Jumat, 23 Mei 2008

Understanding our behavioral blind spots

By Don Grant

Investment decisions are among the most important life choices a person can make. They may determine where your children will be able to go to college, when you’ll be able to retire, or what kind of lifestyle you’ll enjoy after you retire.

Unfortunately, these are also some of the most difficult choices a person can make. In order to make sound decisions, we need to be aware of our own psychological blind spots. These can lead us to make persistently poor financial choices—errors that over time can do significant damage to our portfolios.

Chains of Thought

Traditional financial theory assumes all investment decisions are made rationally, based on the best available information. In theory, the result is an efficient market—one in which prices accurately reflect fundamentals, such as earnings and interest rates.
However, it’s not always easy to reconcile financial theory with financial reality. Investors often appear determined to ignore the fundamentals, both in bidding stock prices up and slamming them back down again.

“In many important ways, real financial markets do not resemble the ones we would imagine if we only read finance textbooks,” notes Richard Thaler, a professor at the University of Chicago and a leading behavioral finance researcher.

It’s not that investors are totally irrational, Thaler and other researchers argue, but rather that their thinking can be influenced by mental biases. These quirks can lead the to make choices that appear intuitively correct, but produce poor performance:

• Overconfidence. Investors generally assume they know more than they actually do. They also tend to remember previous investment decisions in ways that exaggerate
their own foresight. This can lead to overly aggressive trading and a reluctance to admit—and correct—mistakes.

• Mental Accounting. Financial experts often advise investors to take their entire portfolio into account when making investment decisions. Yet, many investors unconsciously divide their wealth into separate pots. If they have a big gain, for example, they may think of it as essentially “free” money and take greater risks with it than they would with their “own” money.

• Anchoring. Logically, investors should always base their decisions on current prices and expectations, . Instead, they often become fixed on past events, such as the price
they paid for a particular stock. Investors will often refuse to sell at a price lower than that—even when it makes more sense to accept their loss and invest their remaining
money elsewhere.

• Framing. How people view a decision often depends on how their choices are presented. For example, in one study researchers asked participants how much they would be willing to pay to avoid a one-in-a-thousand chance of being killed. The average answer was $1,000. Participants were then asked how much they would demand to accept the same risk. This time, the answers ranged as high as $200,000. From an economic point of view, the two questions were identical, but subjects saw them very differently.

• Loss Aversion. In a completely rational market, the risk of loss and the possibility of gain should carry equal weight. However, on average investors place twice as much
importance on avoiding a loss as they do on making a gain. In other words, to accept a 50% chance of losing $100, most people will demand at least a 50% chance of earning $200.

The Value of Advice
Are investors doomed to repeat these mistakes? Maybe not. Some studies have shown that the more investors know about the investment process, the less likely they are to be
misled by behavioral biases.

This is one reason we encourage investors to develop prudent, long-term investment strategies that take into account their goals and tolerance for risk. While this doesn’t
guarantee investment success, it can at least reduce the risk of being led astray by behavioral blind spots. That’s something even the smartest investor might want to keep in mind.

Don Grant is a Financial Advisor with Smith Barney located in Wichita and may be reached at 316.630.4415.
Source :http://www.derbyreporter.com/opinions

Enjoying spring warbler migration

Have you noticed friends or coworkers looking a little sleep-deprived lately? Perhaps these same people complain of a sore neck, and look past you into the trees while you’re talking. You may be encountering birders caught up in the excitement of spring migration.

Sure, a variety of birds have been migrating through central Illinois since February. During the late winter and early spring approximately 240 species of birds belonging to 39 families pass this way. But for most birders, the highlight of spring is songbird migration, and that becomes most intense in the next couple of weeks.

There are great numbers of birds and a great variety of species represented in this wave. According to Dave Enstrom of the Illinois Natural History Survey in Champaign, hundreds of thousands of individuals belonging to over 120 species move through or into central Illinois at this time.

Most exciting among these are members of a family of birds known as warblers. [The hooded warbler, right, was photographed at Busey Woods in Urbana by Greg Lambeth. Click here to see Greg's other bird photos.] These are strikingly beautiful little birds that average only about a third of an ounce in weight. Although they are small, warblers migrate long distances, from wintering ranges in Mexico, Central, and South America to breeding areas in the U.S. and Canada.

As they move north, warblers feed on insects, especially the caterpillars, bees and wasps that populate the crowns of trees as they flower and leaf out. (This habit of the birds accounts for “warbler neck” among birders who spend too much time looking up at them.)

Although 20 species of warblers breed in Illinois, only 7 species nest in Champaign County. Most individuals of the 37 warbler species that occur in Illinois are just passing through on their way further north.

Ironically, the highly fragmented nature of the central Illinois landscape makes for great warbler watching. Migrating birds that need trees to feed in when they stop are concentrated in urban areas and the isolated woodlands that remain here.

It seems almost foolish to try to describe in words the vivid beauty that prompts birders to get out before sunrise day after day. Some warblers are all about color. The blackburnian warbler’s throat and head, for instance, exhibit such a bright combination of orange and yellow that it looks to be on fire. [Click here to see photo and species account at the Cornell Lab of Ornithology's "All About Birds" website.] And the cerulean warbler—well, if you’ve only experienced “cerulean” as the color of a crayon, you’ve got to see this bird.

Other warblers are about patterns. The aptly named black and white warbler, for example, makes up for its lack of color in the same way a zebra does, by sporting stripes so bold they appear to be painted.

If you’re new to birding, or just interested in getting out with people who share your enthusiasm, you might want to check out the Sunday morning bird walks hosted by the Champaign County Audubon Society at Busey Woods in Urbana. Walks start out from the parking lot of the Anita Purves Nature center at 7:30 a.m. and last until about 9:00.


Why not bike?

The weather couldn’t be better. Gas prices are sky high. Do you need any more inducement to save a trip or two in the car by getting out your bicycle? Here’s why I think you should.

Bicycling is good for the planet. It requires no fossil fuel, and so alleviates all of the environmental damage caused by drilling for, transporting, and processing oil. It uses no biofuel, and so exists outside the complicated push and pull over using crops for energy. It emits no greenhouse gasses to degrade the planet over the long term, or other pollutants to degrade human health in the short term. It creates no noise pollution. It decreases traffic congestion. It decreases wear and tear on roads (which cost more and more to fix as the price of oil rises.) It decreases the need for parking, which frees up space for higher purposes, and provides the host of other benefits that come from having less pavement.

Bicycling is also good for people. It gets you out of the artificial environment of your car and puts you in touch with the natural world—the real world—even when you’re riding in the city. It allows you to see and also smell the gorgeous magnolias as you ride by. It allows you to hear the songs and calls of birds. (And if you’re attuned to birds, to be reminded of how life in the Midwest is connected to life elsewhere as spring migration progresses.) It allows you to connect with other people who are walking or cycling, even if it’s just to say hello. Think of how different it is to pull up next to neighbor or coworker on a bike than to pull up next to them in a car.

Bicycling allows you to reconnect with yourself through contemplation, away from the pull of a car radio or CD player. Bicycling gives you the satisfaction of getting from one place to another by the power of your own body, a deep satisfaction, but one that can be forgotten when it’s experienced too infrequently. Like any other form of physical activity, bicycling regularly is energizing, not draining, an antidote to the sluggishness that can come from working in a store or office.

If you are hesitant about biking because of how drivers of cars behave or how poorly the traffic patterns on some streets accommodate it, take heart. The cities of Champaign and Urbana have both recently approved well thought out plans to facilitate cycling in the years to come. [Links to plans for Champaign and Urbana.] These plans include a mix of re-marking streets where cars and bikes can operate together well, along with creating side paths for cycling next to roads with high speed limits and few crossings. Of course Illinois law already treats bicycles as vehicles, and it is perfectly reasonable and legal for cyclists to use the streets as vehicles already. The point of marking routes for cycling is to help clarify for drivers and cyclists alike how they should behave on the road.

If you want further encouragement still, know that May is National Bike Month, which will be marked by a slew of activities in Champaign-Urbana. You can kick off Bike Month with the second annual Bicycle Festival set to take place Sunday May 4th at Hessel Park in Champaign and hosted by the group Champaign County Bikes. From there, you may just want to see where your wheels take you.


Vehicles and Fuels

Motor vehicles are a major source of air pollution worldwide. In many urban areas, motor vehicles collectively produce 50 to 90 percent of local air pollution, depending upon the pollutant. Vehicles can also produce a significant amount of the toxic or hazardous pollutants found in our air. Motor vehicles are typically divided into on-road and nonroad categories for regulatory purposes. Most nations set standards for both engines and fuels in order to reduce air pollution. In the U.S., only EPA and the State of California are permitted to establish new vehicle and fuel standards; other states may adopt California standards if they choose. In addition to engine and fuel characteristics, mobile source emissions are also affected by ambient conditions, driving behavior, and transportation system characteristics.


Cars, Trucks and Buses

Automobiles, motorcycles, trucks, and buses are commonly referred to as “on-road” mobile sources. Automobiles and light-duty trucks are a major source of air pollution all over the world. Emissions from these vehicles come from the tailpipe. Gasoline powered vehicles also generate evaporative emissions from fuel tanks, out of the oil reservoir, and around engine seals. Gasoline refueling vapors are also a significant source of emissions. Most cars and light-duty trucks are fueled by gasoline, and generate large quantities of volatile organic compounds (VOCs), nitrogen oxides (NOx), carbon monoxide (CO), and carbon dioxide (CO2) emissions. Motorcycles represent a large part of the vehicle fleet in developing countries. Two-stroke motorcycles are especially polluting and can emit more air pollution than a small fleet of modern automobiles. Most heavy-duty trucks and buses are powered by diesel fuel, which can generate significant amounts of NOx and sulfur oxide (SOx) emissions (especially in areas with high-sulfur content fuels), as well as potentially cancer-causing particulate matter. Emission controls for modern gasoline vehicles are capable of reducing vehicle emissions by more than 95 percent compared to uncontrolled carbureted vehicles. Diesel vehicle controls have also provided substantial reductions, especially for particulate matter (PM), although further NOx reductions require highly advanced engine technologies or retrofit of aftertreatment devices.


Fuels

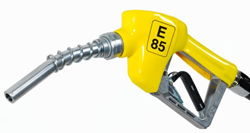
Gasoline and diesel fuels are complex mixtures of many different chemicals. The precise combination of chemicals determines key fuel properties such as energy content, volatility (i.e., ability to vaporize), and the fuel’s ability to ignite and burn in the engine. In turn, the various fuel properties effect vehicle emissions, performance, and fuel cost. Fuel producers have developed different gasoline and diesel formulations designed for specific vehicle and engine technologies to provide adequate vehicle performance and decreased emissions at a reasonable cost. In fact, a vehicle and its fuel should be viewed as an integrated system, with fuel properties designed to match specific engine technologies, and vice versa. Fuel standards can also be designed to control specific pollutants. Depending upon the air quality conditions in a particular local area, fuel properties can be adjusted to reduce CO, hydrocarbon, NOx, or even PM emissions from vehicles. Some areas change their fuel formulations on a seasonal basis to address wintertime CO and summertime ozone problems. In many instances adopting new fuel standards can bring about immediate, cost-effective emission reductions, without making changes to an area’s vehicle fleet. Other fuel changes may be designed for the introduction of new, cleaner vehicles over the long-term. Alternatives to traditional fuels include compressed natural gas, biodiesel, ethanol, liquefied natural gas, methanol and propane. Hydrogen has been identified as a potential “fuel of the future,” with little to no net emissions. The advent of fuel cells as a potentially viable power source for vehicles has further raised the interest in hydrogen as a fuel.


Other Engines and Equipment

Offroad mobile sources are defined as motorized equipment that is portable or self-propelled, but not certified for operation on roadways. Typical offroad equipment includes construction and farm equipment, airplanes, ships, locomotives, lawn and garden equipment, mobile generators and pumps, among many others. Increases in air traffic and shipping, along with construction activities, have resulted in significant emissions from nonroad sources in recent years. As emission controls on automobiles, trucks, and buses become more prevalent, the relative amount of air emissions generated by nonroad sources is becoming more significant. In general, smaller, lighter equipment is dominated by gasoline engines, while larger equipment relies heavily on diesel engines. In most cases offroad equipment is not centrally registered. In addition, offroad equipment operation profiles can vary widely depending upon the specific application and operator. For these reasons, engine populations, use patterns, and resulting emissions from these sources are much more uncertain than for on-road sources.


Source : http://www.cleanairworld.org/TopicDetails.asp?parent=24

Measuring Air Pollution

Air pollution can be directly measured as it is emitted by a source in mass/volume of emission (e.g., grams/m3) or mass/process parameter (e.g., grams/Kg fuel consumed or grams/second). Air pollution can also be measured in the atmosphere as a concentration (e.g., micrograms/m3). Ambient air monitoring data is used to determine air quality, establish the extent of air pollution problems, assess whether established standards are being met, and characterize the potential human health risk in an area. Alternatively, air pollution concentrations can be simulated using computer models, and then validated using data collected from direct measurements at selected monitors or sources. Air pollution data and models are used together to examine the impacts of control strategies on the ambient air.


Air Quality Modeling

As an alternative to or in conjunction with direct monitoring, computer models are often used to predict the levels of pollutants emitted from various types of sources, and how these emissions eventually impact ambient air quality over time. The models themselves vary in terms of sophistication, accuracy and precision of their outputs. Different models are used to estimate emission rates, source activity levels, and ambient air quality impacts. For example, models are available for estimating emissions from mobile and stationary sources, predicting meteorological factors, locating potential emission point sources, and the likely photochemical and dispersion characteristics of air pollution, as well as predicting traffic patterns and congestion. In addition, emissions models and preprocessors can be used to provide input data for air quality models that need emissions based on chemical species, and broken down into very fine temporal (e.g., grams/second) and spatial (1 km x 1 km grid) resolution.


Monitoring

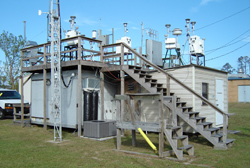
Air pollution monitoring activities are typically separated into two classifications: source monitoring and ambient air monitoring. Monitoring can be made directly using continuous measurement instrumentation or manual methods, or remotely using optical sensing systems. Source monitoring involves the measurement of emissions directly from a fixed or mobile emission source, typically in a contained duct, vent, stack or chimney. Stationary source data is used to determine control technology performance, confirm established permit limits are being met, and as input to ozone and/or health risk prediction models. Major stationary sources may have continuous emissions monitors (CEMs) installed to report real-time emissions based on pre-established reporting cycles. Ambient air monitoring involves the measurement of specific pollutants present in an immediate surrounding atmosphere. Most Major urban areas often operate several ambient air monitoring instruments, each dedicated to measuring specific target pollutants.


Source : http://www.cleanairworld.org/TopicDetails.asp?parent=24

Control Strategies

Reductions in air pollution can be achieved by a variety of methods including pollution prevention, control technologies, and control measures, and may be implemented through regulatory, market-based or voluntary programs. A control strategy may include a combination of different voluntary measures or mandatory controls, may focus on one or several pollutants or sources of air pollution, and can be implemented on a local, regional, national, or international scale. Energy efficiency, process changes,, and solventless coatings are examples of pollution prevention strategies. Many of the air quality improvements to date have been achieved through technological developments. Air pollution control technologies have achieved stunning results in reducing emissions from the manufacturing and mobile source sectors by as much as 90 to 99 percent. Continuing advances in both pollution prevention and air pollution control technology should enable further emissions reductions to offset increased emissions caused by continued population growth and worldwide economic development.


Mercury and Other Toxic Air Pollutants

Control of mercury emissions is based upon reduction of the emissions and pollutant releases into the atmosphere by the industries that use mercury within their processes, emit mercury or dispose of products containing mercury, such as thermometers. In the U.S., national emission standards for hazardous air pollutants (NESHAPS) have been established for industries emitting toxic air emissions that require the use of Maximum Achievable Control Technology (MACT) for compliance. For example, mercury NESHAP/MACT standards have been promulgated for hazardous and municipal waste incineration, commercial/industrial boilers, chlor-alkali plants, and portland cement kilns. Strategies for controlling mercury and other toxic air pollutants include pollution prevention measures, including product substitution, process modification, work-practice standards and materials separation; coal cleaning (relevant to mercury control); flue gas treatment technologies; and alternative strategies. Significant sources of toxic air pollution are motor vehicles, so programs to reduce emissions from cars, trucks and buses also decrease concentrations of toxic air pollutants. These programs include reformulated gasoline, the national low emission vehicle (NLEV) program, and gasoline sulfur control requirements, among others.


Ozone

Ozone control strategies generally target nitrogen oxides (NOx) and volatile organic compounds (VOCs), the primary contributors to ozone formation in the troposphere. Control strategies may comprise a set of regulations that specify emission limits and/or control equipment that are deemed to be reasonable available control technology (RACT), best available control technology (BACT), lowest achievable emission rates (LAER), depending on the severity of the air pollution problem in the area. NOx and VOC control equipment or programs may address specific industrial processes;on-road vehicles; nonroad equipment such as locomotives; or nonpoint sources such as small industrial boilers, dry cleaners, and consumer solvents. Pollution prevention measures such as use of non- or low-VOC content solvents and coatings can also be part of an effective ozone control strategy.


Particle Pollution

Particle pollution, or particulate matter (PM) pollution control strategies reduce primary PM emitted directly by a source, or PM precursor emissions (NOx, SOx, VOC, and ammonia) that react in the atmosphere to form fine PM. Control strategies could include a set of regulations that specifies emission limits in either mass or opacity units. PM control equipment or programs may address specific industrial processes; nonroad equipment such as locomotives and other equipment that burns diesel fuel; and nonpoint sources such as dust from agricultural activities and travel on paved and unpaved roads, and smoke from fireplaces and woodstoves.


Source : http://www.cleanairworld.org/TopicDetails.asp?parent=7

Air Pollutants

There are many types of air pollutants. The exact composition and concentration of pollutants depend on the source activity or process, the type of fuel and/or chemicals involved, and in some cases the meteorological conditions under which the pollutant is emitted. Air pollutants are pervasive, and are responsible for a range of adverse health and environmental effects. These pollutants include hydrocarbons (HC), carbon monoxide (CO), nitrogen oxides (NOx), particulate matter (PM), sulfur dioxide (SO2), ozone, volatile organic compounds (VOCs), hydrogen sulfide (H2S), and toxic air contaminants such as lead (Pb). Greenhouse gases such as carbon dioxide (CO2), nitrous oxide (N2O), methane (CH4), and high-global warming potential gases (e.g., perfluorocarbons, sulfur hexafluoride, hydrofluorocarbons, nitrogen trifluoride, hydrofluoroethers, and ozone depleting substances) have been implicated in global warming effects. Sources of air pollution also emit quantities of other substances which are often referred to collectively as toxic or “hazardous” air pollutants (HAPs). These pollutants can have more serious health impacts than some of the general pollutants, depending on the level of exposure. In many cases, toxic pollutants constitute a small fraction of the total HC or PM emissions.


Greenhouse Gases

One of the key contributors to global warming is the increased emissions of greenhouse gases (GHGs). When solar radiation passes into the Earth’s atmosphere, most is absorbed by the Earth and some is reradiated back into the atmosphere. GHGs trap the heat, keep it from passing through the atmosphere to space, thus causing the lower atmosphere to warm. Some GHGs occur naturally in the atmosphere, while others are emitting strictly by human activity.

CO2 is emitted by combustion of fossil fuels (oil, natural gas, and coal), solid waste, biomass (e.g., wood products), and by industrial processes (e.g., cement kilns). Also, CO2 can be removed from the atmosphere (or “sequestered”) when it is absorbed by plants as part of the biological carbon cycle. CH4 is emitted during the production and transport of fossil fuels, and can be emitted through livestock and other agricultural practices and by the decay of landfill wastes. N2O is emitted by fossil fuel and solid waste combustion, and during agricultural and industrial activities, Hydrofluorocarbons, sulfur hexafluoride, and perfluorocarbons are emitted from a wide range of industrial processes, including during their production as well as their use in refrigeration and air conditioning, during semiconductor manufacturing, and as substitutes for ozone depleting substances (ODCs). Although these gases are typically emitted in smaller quantities relative to CO2, they have a higher global warming potential (GWP), and are sometimes referred to as “high GWP gases”.


Mercury and Other Toxic Air Pollutants

Toxic air pollutants are substances that cause or may cause cancer or other serious health effects, such as reproductive or birth defects, and neurological, cardiovascular, and respiratory disease. They can be found in gaseous, aerosol, or particulate forms. Some toxic air pollutants, such as mercury (Hg), are persistent bioaccumulative toxics (i.e., they are stored indefinitely in the body and increase over time). These toxics can deposit onto soils or surface waters, where they are taken up by plants and are ingested by animals, with concentrations increasing as the toxics move up through the food chain to humans. Sources of hazardous air pollutants include stationary sources such as factories, dry cleaners, and hospitals, as well as mobile sources such as cars, buses, and construction equipment.


Ozone

Ozone (O3) is created by a chemical reaction between NOx and VOCs that is generated by heat and sunlight. A large share of ozone-generating pollutants are produced by motor vehicles, although any fuel combustion source emits the pollutants that can contribute to ozone formation. Ozone is a major problem in many urban areas around the world where it can reduce lung capacity and increase susceptibility to respiratory illnesses, especially in infants and the elderly.


Particle Pollution

Particulate matter can be either emitted directly by sources (primary) or formed in the atmosphere from precursors (secondary). Primary particles are generated by combustion such as the burning of diesel fuel, and by mechanical generation such as the churning of road dust, brake wear, and construction activities. Secondary particles form in the air due to complex chemical reactions that convert gaseous precursor pollutants into particles. Most dangerous are the fine particles (PM2.5) which can be absorbed deep in the lungs, causing aggravated asthma, decreased lung function, lung cancer, cardiac problems, and premature death.


Source : http://www.cleanairworld.org/TopicDetails.asp?parent=2

Climate Change

Global climate change refers to any significant change in measures of climate (such as temperature, precipitation, or wind) lasting for an extended period (decades or longer). Global warming, a term which refers to an average increase in the temperature of the atmosphere near the Earth’s surface, can contribute to changes in global climate patterns and is influenced by both human activities and natural causes. One of the key contributors to global warming is the increased emissions of greenhouse gases (GHGs) resulting from human activities.

Human activities, such as the burning of fossil fuels, deforestation, and agricultural practices, have caused the concentrations of heat-trapping GHGs to increase significantly in the atmosphere. Since the beginning of the industrial revolution, atmospheric concentrations of greenhouse gases (GHGs) have increased at an accelerating pace because of human activities. According to the 2007 findings of the Intergovernmental Panel on Climate Change, concentrations of carbon dioxide (CO) have increased 35%, methane (CH4) concentrations have increase almost 150%, and nitrous oxide (N2O) concentrations have risen by 18% since the pre-industrial era. These increases have enhanced the heat-trapping capability of the earth's atmosphere. According to NOAA and NASA data, the Earth’s average surface temperature has increased by about 1.2 to 1.4 degrees since 1900. There is general consensus among the world’s leading climate modelers that the buildup of GHGs will lead to further increases in the worldwide average temperature, with potential impacts that may include rising sea levels, erosion of coast lines, increased storm intensity, changing rainfall patterns, and loss and migration of species.

In 1993, most world countries joined an international treaty -- the United Nations Framework Convention on Climate Change (UNFCCC) -- to begin to consider what can be done to reduce global warming and to cope with whatever temperature increases are inevitable. In 2005, an addition to the treaty known as the Kyoto Protocol formally entered into force. The Kyoto Protocol contains quantified, country-specific emission reduction targets for the period of 2008-2012 and legally binding commitments to these reductions for 36 countries. In January 2005 the European Union Greenhouse Gas Emission Trading Scheme (EU ETS) commenced operation as the largest multi-country, multi-sector Greenhouse Gas emission trading scheme world-wide. The aim of the EU ETS is to help EU Member States achieve compliance with their commitments under the Kyoto Protocol. The Prototype Carbon Fund, a partnership between seventeen companies and six governments and managed by the World Bank, became operational in April 2000. This fund helps establish the market for project-based greenhouse gas emission reductions while promoting sustainable development.

In 2004, the international Methane to Markets Partnership was launched as a voluntary, non-binding framework for international cooperation to advance the recovery and use of methane as a valuable clean energy source. Under the Partnership, countries make formal declarations to minimize methane emissions from key sources, stressing the importance of implementing methane capture and use projects in developing countries and countries with economies in transition. The Asia-Pacific Partnership on Clean Development and Climate is an innovative new effort to accelerate the development and deployment of clean energy technologies.

There have also been a number of regional, state and local initiatives to address climate change in the United States. In 2005, Governors of seven Northeast States signed a Memorandum of Understanding to develop a CO2 cap and trade initiative known as the Regional Greenhouse Gas Initiative (RGGI). In 2006, California became the first state to pass a comprehensive GHG emission reduction regulation under legislative bill AB32, which has the potential to cover a wide range of source categories depending on how significant sources are ultimately defined. The recently established national Climate Change Registry is a collaboration between states, provinces and tribes aimed at developing and managing a common GHG emissions reporting system that is capable of supporting various GHG emission reporting and reduction policies for its member states and tribes and reporting entities. Many states have also developed their own individual climate change action plans to identify and implement specific activities and responses to potential climate change impacts within their states.


Source : http://www.cleanairworld.org/TopicDetails.asp?parent=19

Kamis, 22 Mei 2008

Water polution

Water polution


What do we use water for?

This diagram is called a mind map. It is a technique that can help you to organise and summarise your ideas. This mind map shows some of the ways that water is used to produce and transport a can of baked beans to a shop. Get learners to draw their own mind maps to show how water is used to make a pair of denim jeans, a pair of leather shoes and / or a loaf of bread. They may have to do some research in the library before they start the activity. Once completed, discuss the different mind maps as a class.

Polluted feelings

(Requirements: elastic bands)

Water quality is defined as water that is safe, drinkable and appealing to all life on Earth. In South Africa the scarce fresh water is decreasing in quality because of an increase in pollution and the destruction of river catchments, caused by urbanisation, deforestation, damming of rivers, destruction of wetlands, industry, mining, agriculture, energy use, and accidental water pollution. If all this pollution is going into our rivers then humans are not respecting our most valuable resource WATER.

Water pollution is, in fact, a major cause of concern in South Africa, and needs to be addressed as a matter of urgency. Allow your learners to experience the effects of water pollution on a water animal or organism by following this activity:

1. Take an elastic band and put it over your thumb.
2. Now twist it once and stretch it across the back of your hand before looping it over your little finger.
3. Take a deep breath and hold it in until you’ve completed step 4 (this simulates the feeling of an animal, such as an otter or heron, being trapped under water by litter and being unable to come up for air).
4. Without using your other hand, your teeth, or rubbing the hand against anything, remove the elastic band.
5. Now have learners describe the experience, answering questions like:

• Could you get free and come up for air?;
• Is it easy to get free from the elastic band?;
• How did it feel to be trapped?;
• Did the elastic band hurt your hand?; and
• What can you do to stop pollution?

Model of a polluted river

Working in groups of five, have learners make their own model of a polluted river. Each group will need:

• a source of water — hose / bucket of water
• to make the river — spade / trowel / guttering / halved swimming pool hose
• a dam — container / basin / 2 litre plastic bottle
• pollutants — harmless substitute ingredients from home, eg. sand, food colouring, lentils, etc.
• bottles / jars
• paper, pens and coloured pencils

STEP 1: Draw up a table listing pollutants that could find their way into a river that flows through a city.
STEP 2:
Think of safe, easily obtainable, substitute ingredients from home that can be used to represent those pollutants.
STEP 3:
Decide on the quantities of "pollutants" that you would like to add to your river. Give reasons for your choice.

Examples of "pollutants"

Pollutant Substitute Ingredients QTY
Insecticides / Pesticides Powder paint 1 tablespoon
Heavy metals Lentils 3 tablespoons
Chemicals Food colouring 1 tablespoon
Litter Sweet papers 2 handfuls
Sewage Coffee 2 tablespoons

STEP 4: Design and build a short river in the school playground or in the classroom. You will need a source of water and a dam at the end.

STEP 5: Pour water into the model. As the water flows down the "river", the "pollutants" can be added at different places along the river.
STEP 6:
Collect the "polluted" water at the end of the river. Fill a bottle with this dirty water.
STEP 7:
Write a label for this water that shows the contents - both good and bad. The labelled bottle can be displayed in the classroom as a reminder of why you need purified tap water.
Now ask learners the following:

• By adding these pollutants to the river what impact would it have on the life in the river?
• Would you drink this water? Give a reason for your answer.
• Do you think humans RESPECT the river by adding these pollutants to the river? Explain.

As a research exercise, ask learners to find out how tap water is cleaned (purified) in their area.

Source : http://www.randwater.co.za/StarinYou/educators/b13_polution.asp

Water Analysis

Why do we need to analyze water?

If water is badly polluted-- like raw sewage--- it might be obvious from its appearance or odor.
It might be colored or turbid (cloudy), or have solids, oil or foam floating on it.
It might have a rotten odor, or smell like industrial chemicals.
A lot of dead fish floating on the surface of a lake would be a clear sign that something was wrong.
But many harmful-- and beneficial-- materials in water are invisible and odorless. In order to go beyond the obvious, to determine what materials are in the water, and how much, we need to be able to conduct chemical or microbiological analyses.

Analysis of a natural body of water will tell us how clean or polluted it is. If there is damage to wildlife, the measurements will help pinpoint the cause-- and the source. In a wastewater treatment plant, analyses are necessary for monitoring the effectiveness of the treatment processes. In the United States, the Clean Water Act requires wastewater dischargers to have permits. These permits set limits on the amounts of specific pollutants which can be discharged, as well as a schedule for monitoring and reporting the results. Usually, the reports must be filed monthly, while the measurement frequency for a particular parameter (measurable property) can run anywhere from "continuously" to just once a year. Only standard analytical procedures specified in the "Code of Federal Regulations" may be used, so that the government agencies can feel reasonably confident that results from different laboratories are comparable.

Similar considerations apply to drinking water. The purity of the water we drink is of more concern to the average person than the quality of the wastewater discharged by the sewage plant. But we should not forget that in many places, especially along a river, one town's wastewater discharge may be part of the next town's water supply...

There are two aspects to water analysis that we need to consider:

  1. what substances or organisms are we interested in testing for-- and why?
  2. what procedures and equipment do we use to make the measurements, and how do they work?
Let's look at the "procedures and equipment" first:

(If you want to read about the "substances and organisms" first,
click here,-- or here for no-frames version-- but the procedures on that page refer to methods discussed below.)

Analytical Methods

Water analyses are done by several methods. The most common types of measurements are gravimetric (weighing), electrochemical (using meters with electrodes) and optical (including visual). Instrumental methods are becoming increasingly popular, and instrumentation is getting "smarter" and easier to use with the inclusion of microprocessors. In the simplest case, a sample may just be placed in an instrument and a result read directly on a display. More often some physical separation technique or chemical procedure is needed before a measurement is made, in order to remove interferences and transform the analyte-- the target of the analysis-- into a form which can be detected by the instrument.

Since even raw sewage is generally more than 99.9% water, most environmental analyses are measuring very low concentrations of materials. The results of these measurements are usually expressed in the units "milligrams per liter," abbreviated as mg/L. Since a milligram is one thousandth of a gram, and a liter of water weighs about a thousand grams, a mg/L is approximately equal to one part per million by weight. A part per million ("ppm") is only one ten thousandth of one percent. For toxic metals and organic compounds of industrial origin, measurements are now routinely made in the part per billion (microgram per liter) range or even lower. At such low levels, sensitive equipment and careful technique are clearly necessary for accurate results. Avoiding contamination of the sample and using methods which prevent interferences from other substances in the water are crucial requirements for successful analyses.

Separation Techniques:

Some measurements require separating the analyte from other substances in the water which may interfere with the measurement. Some measurements even require separating the analyte from the water entirely. Separation techniques include:
  • Filtration: The water is passed through a fine-pore filter which can be made of paper, glass fibers, a cellulose acetate membrane, etc. Filtration through a filter of some agreed-upon standard pore size can be used to separate "suspended" from "dissolved" portions of the analyte. The analyte may be the suspended matter which is captured on the filter-- or the filter may be used to clarify the water for analysis of a dissolved material. Often, the filtration is assisted by applying a vacuum below the filter, which is supported on a porous holder in some type of funnel.
  • Distillation: If the analyte can be boiled out of the water, or along with the water, then the vapors can be cooled and re-condensed or trapped in a liquid form in a different container. This way the analyte can be removed from the interfering substances in the original water sample. Often the sample is made acidic or alkaline, or treated chemically in some other way before distillation, to convert the analyte into a volatile (easily evaporated) form, and to immobilize or neutralize interfering substances.
  • Extraction: Some analytes may be much more soluble in an organic solvent than in water. If the solvent does not mix with water, and the sample is shaken with portions of the solvent, almost all of the analyte may be transferred from the water into the solvent, leaving interfering substances behind. This is known as a "liquid-liquid" extraction. The analysis may be completed using the organic portion. There are also continuous versions of this process for use with liquid or with dry samples.
    Another type of extraction is called "solid-phase extraction." In this kind of procedure, the sample is passed through a column or filter containing a powdered or granulated material which retains (adsorbs) the substances of interest and allows other types of dissolved materials to pass through. Then a solvent, or an acid or alkaline solution, can be passed through to de-sorb and redissolve the analytes, a process known as elution.
    Either type of extraction can also be used to concentrate the analyte into a smaller total volume, which increases the sensitivity of the analysis. This can be true for distillation or filtration, as well.

Measurement Techniques:

  • Gravimetric analysis or, simply, weighing:
    Analytical balances routinely used for gravimetric analysis are sensitive to one tenth of a milligram, or one ten-thousandth of a gram. Most laboratories use electronic balances with direct digital readouts. For a measurement of the milligrams per liter of solids in the water, a measured volume of sample can be dried in a tared (pre-weighed) dish; the dish plus solids are weighed after the water has evaporated off; the weight of solids is calculated by subtraction, and the concentration figured by dividing the weight of solids by the volume of the sample. For a filtered sample, the tared filter itself is dried along with the solids it captured, and the suspended solids (those captured on the filter) calculated in the same way. In some chemical analyses, a precipitate is formed by reacting the analyte of interest with another chemical reagent (reacting chemical); then the precipitate can be filtered, dried, and weighed as a suspended solid. This type of analysis is more common with water solutions that are more concentrated than environmental samples, though, such as chemicals purchased for use in water or wastewater treatment.
  • Electrochemical:
    The outer portions of all atoms and molecules consist of "shells" of electrons, and all chemical reactions involve interactions with these outer electrons-- sharing or transfer, or something in between. It is not surprising,, then, that electricity and chemistry are interrelated (just think of batteries), and that electrical measurements can be used to detect and determine some substances of interest. The procedures involve placing electrodes in a water sample and measuring either an electrical potential (voltage), in millivolts, or a current, in milliamperes, which is related to the concentration of analyte. Depending on what they are designed to measure, electrodes can be simple pieces of metals such as gold, silver, platinum, copper, etc.; or they may be elaborate systems with semi-permiable membranes and several internal electrodes and filling solutions. The instrumentation may be capable of reading out directly in concentration units. Usually some sort of calibration procedure is necessary, using one or more standard solutions of known concentration.
  • Colorimetry or spectrophotometry:
    This method involves measuring the intensity of a color in a solution and relating it to the concentration of the analyte. While some materials of interest are already colored, most of these analyses require the analyst to add some chemical reagents (reacting chemicals) to a sample to produce a characteristic color.
    The simplest type of measurement is visual comparison of the intensity of the color to a set of color standards which represent various concentrations of the analyte. While this is method does not require any expensive equipment, color perception is rather subjective-- and many people have some degree of color-blindness.
    A more precise measurement can be made using a colorimeter. A colorimeter is a device consisting of 1) a light source, which can be as simple as tungsten-filament light bulb; 2) some optics for focusing the light 3) a colored filter, which passes light of the color which is absorbed by the treated sample; 4) a sample compartment to hold a transparent tube or cell containing the sample, 5) a light-sensitive detector, like the light meter on a camera, which converts the light intensity into an electric current, and 6) electronics for measuring and displaying the output of the detector. Some colorimeters may be designed to read out directly in concentration units, while others may show the results in units of light absorbance which need to be compared to a calibration curve. (An interesting point is that the filter is not the same color as the solution being tested, but rather the complementary color. We want to use a filter which transmits light of the color which the solution absorbs. A yellow solution looks yellow because it absorbs blue light, so a blue filter would be used.)
    If we want to get more precise and more interference-free measurements, we can use a spectrophotometer. This is very similar to a colorimeter, except that instead of using a filter to select the color of light to pass through the sample, we instead break the white light up into a rainbow (spectrum) of colors using a prism or a diffraction grating. The light is passed through a narrow opening (slit) before reaching the sample. By rotating the prism or grating, the color {"wavelength") of light can be selected more precisely and we can better match the color with that absorbed by the sample. The principle is shown in the diagram below.spectrophotometer image Needless to say, spectrophotometers cost more than colorimeters, and are likely to be more delicate and less portable, as well. While many tests are done using visible light, some analyses also make use of the invisible ultraviolet or infrared portions of the spectrum. Scanning spectro photometers can also be used to identify some types of analytes by the wavelengths or colors of the light they absorb.
    There is a variation of this type of testing, usually referred to as atomic spectroscopy, which is used mostly for trace metal analysis. The sample is converted to a gas by one of several methods-- usually involving heating. Then the light from a lamp containing the same metal is passed though the gas and the absorbance measured just as with a liquid sample (atomic absorption spectrophotometry). Alternatively, the intensity of the light emitted from the heated atoms of the metal in the gas can be used as a way of measuring the concentration (atomic emission spectrophotometry). A very popular atomic emission method in use today is called inductively coupled plasma spectrometry. The sample is carried in a stream of argon gas surrounded by coils which emit radio frequency energy that converts some of the gas into a very hot, ionized (electrically charged) form. An advantage of this method is that many elements can be measured simultaneously, or in rapid succession.
  • Titration:
    Titration depends on using a well-defined chemical reaction to measure the amount of a standard solution needed to react with certain amount of the sample. A known volume, such as 100 mL, of sample is placed into a flask or beaker. The standard reagent is dispensed from a graduated tube called a burette so the volume used can be measured. The "end point" of the reaction is usually determined by observing a color change in an indicator solution, which is added to the flask before the start of the titration. End points are also often determined using electrochemical equipment. Once we know how much of the standard reagent was needed, we can calculate the amount of the analyte that is in the sample, because the reaction will always use the same proportion of the two materials. A common example is measuring the concentration of an acid by titrating with a standard base, such as sodium hydroxide.
  • Chromatography:
    This technique got its name, which means "color picture", because it was first used to separate colored pigments from a single spot on a piece of paper. A solvent, such as alcohol, is allowed to move slowly across the paper, and the different components of the pigment travel at different rates. The result is a series of separated spots of different colors. They move at different rates because of differences in the pigments' relative attraction to the paper (the "stationary phase") and their solubility in the solvent (the "mobile phase"). This principle is used in modern instrumentation to separate mixtures of organic chemicals or inorganic ions. The components can be identified by their retention times,-- i.e., how long it takes them to pass through the instrument-- and detectors can be used to measure the amount of each component.
    In gas chromatography, (or, simply, "GC") the mixture of substances is injected into a narrow, coiled column, several feet long, made of an inert material like glass, silica or stainless steel. The sample has usually been extracted into an organic solvent and concentrated by evaporation as a pretreatment step. The column may be filled with an oil-coated, powdered mineral, which forms the stationary phase. In the narrower capillary columns, the stationary phase is bonded directly to the wall of the tubing. The columns are usually contained in an oven, which may be programmable to raise the temperature at a controlled rate over time. Heating the column allows analysts to use this technique on many substances which are not gases at room temperature, including solvents and toxic chemicals like pesticides and PCB's. A continuous flow of an inert gas, such as argon, helium, or sometimes nitrogen, carries the evaporated mixture through the column. The substances are detected as they exit the column, usually by a technique that converts them into ions (electrically charged atoms or molecules), although one method uses heat conduction. The ions are produced by means such as flames, ultraviolet light, or radioactive materials. They are detected by being attracted to charged plates, where they produce an electrical current proportional to the amount present. The output of the detector usually is shown as a chart of "peaks" vs. time, called a chromatogram, often with the retention time and the intensity of the peak printed out. The retention time is used to identify the substance, while the height or area of the peak is used to quantify its concentration. A more positive identification is possible using a mass spectrometer (see below) as the detector.
    For substances which cannot easily be vaporized because of high boiling point or instability at higher temperatures, there is a liquid version of this technique know as HPLC (High pressure or high performance liquid chromatography). Organic solvents are used as the mobile phase. Ultraviolet (UV) light absorption is often used for detection. Herbicides and pharmaceuticals are common types of substances analyzed by this technique. Another variation of LC is ion chromatography, (IC), where the target analytes are charged inorganic or organic substances. The mobile phase is an aqueous (water-based) solution, and the stationary phase is made up of an ion exchange resin. The detectors usually measure electrical conductivity, although UV absorption can also be used. This technique can be used to measure the concentrations of several important inorganic anions, such as fluoride, sulfate, phosphate, and nitrate all in one analysis
  • Mass Spectrometry:
    In a mass spectrometer, an ionized vapor is passed between magnets or radio frequency coils which separate the ions by mass (actually by charge to mass ratio). The pattern produced is characteristic of the particular substance, which can be identified by comparison with computerized "libraries" of mass spectra. While the instrumentation can be used alone, for environmental analyses it is usually used in tandem with another technique. Used as a "detector" for gas chromatography ("GC-MS"), it can positively identified components which have already been separated from a mixture. There is some use with liquid chromatography, as well (LC-MS). As a detector for metal ions produced in an ICP (see above), it provides very high sensitivity and is being used to determine very low levels of metal in drinking water, and may soon be approved for wastewater effluents and receiving waters.
Source : http://www.geocities.com/rainforest/5161/lab1.htm

How is Wastewater Treated to Remove Pollutants?

Physics, Chemistry, Microbiology and Engineering are all involved in purifying wastewater so that it can be safely returned to the environment.

Wastewater treatment plants can be divided into two major types:
Biological and Physical/Chemical.

Biological plants are more commonly used to treat domestic or combined domestic and industrial wastewater from a municipality. They use basically the same processes that would occur naturally in the receiving water, but give them a place to happen under controlled conditions, so that the cleansing reactions are completed before the water is discharged into the environment.
Physical/chemical plants are more often used to treat industrial wastewaters directly, because they often contain pollutants which cannot be removed efficiently by microorganisms-- although industries that deal with biodegradable materials, such as food processing, dairies, breweries, and even paper, plastics and petrochemicals, may use biological treatment. And biological plants generally use some physical and chemical processes, too.

A physical process usually treats suspended, rather than dissolved pollutants. It may be a passive process, such as simply allowing suspended pollutants to settle out or float to the top naturally-- depending on whether they are more or less dense than water. Or the process may be aided mechanically, such as by gently stirring the water to cause more small particles to bump into each other and stick together, forming larger particles which will settle or rise faster-- a process known as flocculation. Chemical flocculants may also be added to produce larger particles. To aid flotation processes, dissolved air under pressure may be added to cause the formation of tiny bubbles which will attach to particles.

Filtration through a medium such as sand as a final treatment stage can result in a very clear water. Ultrafiltration, nanofiltration, and reverse osmosis are processes which force water through membranes and can remove colloidal material (very fine, electrically charged particles, which will not settle) and even some dissolved matter. Absorption (adsorption, technically) on activated charcoal is a physical process which can remove dissolved chemicals. Air or steam stripping can be used to remove pollutants that are gasses or low-boiling liquids from water, and the vapors which are removed in this way are also often passed through beds of activated charcoal to prevent air pollution. These last processes are used mostly in industrial treatment plants, though activated charcoal is common in municipal plants, as well, for odor control.

Some examples of chemical treatment processes, in an industrial setting, would be

  • converting a dissolved metal into a solid, settleable form by precipitation with an alkaline material like sodium or calcium hydroxide. Dissolved iron or aluminum salts or organic coagulant aids like polyelectrolytes can be added to help flocculate and settle (or float) the precipitated metal.
  • converting highly toxic cyanides used in mining and metal finishing industries into harmless carbon dioxide and nitrogen by oxidizing them with chlorine
  • destroying organic chemicals by oxidizing them using ozone or hydrogen peroxide, either alone or in combination with catalysts (chemicals which speed up reactions) and/or ultraviolet light
In municipal treatment plants, chemical treatment-- in the form of aluminum or iron salts-- is often used for removal of phosphorus by precipitation. Chlorine or ozone (or ultraviolet light) may be used for disinfection, that is, killing harmful microorganisms before the final discharge of the wastewater. Sulfur dioxide or sulfite solutions can be used to neutralize (reduce) excess chlorine, which is toxic to aquatic life. Chemical coagulants are also used extensively in sludge treatment to thicken the solids and promote the removal of water.

A typical treatment plant consists of a train of individual unit processes set up in a series, with the output (effluent) of one process becoming the input (influent) of the next process. The first stages will usually be made up of physical processes that take out easily removable pollutants. After this, the remaining pollutants are generally treated further by biological or chemical processes. These may 1) convert dissolved or colloidal impurities into a solid or gaseous form, so that they can be removed physically, or 2) convert them into dissolved materials which remain in the water, but are not considered as undesirable as the original pollutants. The solids (residuals or sludges) which result from these processes form a side stream which also has to be treated for disposal.

A common set of processes that might be found at a municipal treatment plant would be:

  • Preliminary treatment to remove large or hard solids that might clog or damage other equipment. These might include grinders (comminuters), bar screens, and grit channels. The first chops up rags and trash; the second simply catches large objects, which can be raked off; the third allows heavier materials, like sand and stones, to settle out, so that they will not cause abrasive wear on downstream equipment. Grit channels also remove larger food particles (i.e., garbage).
  • Primary settling basins, where the water flows slowly for up to a few hours, to allow organic suspended matter to settle out or float to the surface. Most of this material has a density not much different from that of water, so it needs to be given enough time to separate. Settling tanks can be rectangular or circular. In either type, the tank needs to be designed with some type of scrapers at the bottom to collect the settled sludge and direct it to a pit from which it can be pumped for further treatment-- and skimmers at the surface, to collect the material that floats to the top (which is given the rather inglorious name of "scum".) The diagram below shows the operation of a typical primary settling tank.

  • Secondary treatment, usually biological, tries to remove the remaining dissolved or colloidal organic matter. Generally, the biodegradation of the pollutants is allowed to take place in a location where plenty of air can be supplied to the microorganisms. This promotes formation of the less offensive, oxidized products. Engineers try to design the capacity of the treatment units so that enough of the impurities will be removed to prevent significant oxygen demand in the receiving water after discharge.

    There are two major types of biological treatment processes: attached growth and suspended growth.

    In an attached growth process, the microorganisms grow on a surface, such as rock or plastic. Examples are 1) open trickling filters, where the water is distributed over rocks and trickles down to underdrains, with air being supplied through vent pipes, 2) enclosed biotowers, which are similar, but more likely to use shaped, plastic media instead of rocks, and 3) so-called rotating biological contacters, or RBC's, which consist of large, partially submerged discs which rotate continuously, so that the microorganisms growing on the disc's surface are repeatedly being exposed alternately to the wastewater and to the air.

    The most common type of suspended growth process is the so-called activated sludge system (see diagram below). This type of system consists of two parts, an aeration tank and a settling tank, or clarifier. The aeration tank contains a "sludge" which is what could be best described as a "mixed microbial culture", containing mostly bacteria, as well as protozoa, fungi, algae, etc. This sludge is constantly mixed and aerated either by compressed air bubblers located along the bottom, or by mechanical aerators on the surface. The wastewater to be treated enters the tank and mixes with the culture, which uses the organic compounds for growth-- producing more microorganisms-- and for respiration, which results mostly in the formation of carbon dioxide and water. The process can also be set up to provide biological removal of the nutrients nitrogen and phosphorus (see below).

    After sufficient aeration time to reach the required level of treatment, the sludge is carried by the flow into the settling tank, or clarifier, which is often of the circular design. (An important condition for the success of this process is the formation of a type of culture which will flocculate naturally, producing a settling sludge and a reasonably clear upper, or supernatant layer. If the sludge does not behave this way, a lot of solids will be remain in the water leaving the clarifier, and the quality of the effluent wastewater will be poor.) The sludge collected at the bottom of the clarifier is then recycled to the aeration tank to consume more organic material. The term "activated" sludge is used, because by the time the sludge is returned to the aeration tank, the microorganisms have been in an environment depleted of "food" for some time, and are in a "hungry", or activated condition, eager to get busy biodegrading some more wastes. Since the amount of microorganisms, or biomass, increases as a result of this process, some must be removed on a regular basis for further treatment and disposal, adding to the solids produced in primary treatment.

Variations:
Sequencing Batch Reactor (SBR):The type of activated sludge system described above is a continuous flow process. There is a variation in which the entire activated sludge process take place in a single tank, but at different times. Steps include filling, aerating, settling, drawing off supernatant, etc. A system like this can provide more flexibility and control over the treatment, including nutrient removal, and is amenable to computer control.
Membrane Bioreactor (MBR): In this more recent innovation, treated water is pumped out of the aeration tank through banks of microfiltration membranes. Clarifiers are not needed. The sludge concentration can be higher than in a conventional system, which allows treatment in a smaller volume; and the sludge's ability to flocculate well is no longer a consideration. Low effluent solids concentrations can be achieved, which can helps in phosphorus removal and disinfection (see below). Click here for links to some commercial pages which discuss this process.

  • Nutrient removal refers to the treatment of the wastewater to take out nitrogen or phosphorus, which can cause nuisance growth of algae or weeds in the receiving water.

    Nitrogen is found in domestic wastewater mostly in the form of ammonia and organic nitrogen. These can be converted to nitrate nitrogen by bacteria, if the plant is designed to provide enough oxygen and a long enough "sludge age" to develop these slow-growing types of organisms. The nitrate which is produced may be discharged; it is still usable as a plant nutrient, but it is much less toxic than ammonia. If more complete removal of nitrogen is required, a biological process can be set up which reduces the nitrate to nitrogen gas (and some nitrous oxide). There are also physical/chemical processes which can remove nitrogen, especially ammonia; they are not as economical for domestic wastewater, but might be suited for an industrial location where no other biological processes are in use. (These methods include alkaline air stripping, ion exchange, and "breakpoint" chlorination.)

    Phosphorous removal is most commonly done by chemical precipitation with iron or aluminum compounds, such as ferric chloride or alum (aluminum sulfate). The solids which are produced can be settled along with other sludges, depending on where in the treatment train the process takes place. ("Lime", or calcium hydroxide, also works, but makes the water very alkaline, which has to be corrected, and produces more sludge.). There is also a biological process for phosphorus removal, which depends on designing an activated sludge system in such a way as to promote the development of certain types of bacteria which have the ability to accumulate excess phosphorus within their cells. These methods mainly convert dissolved phosphorus into particulate form. For treatment plants which are required to discharge only very low concentrations of total phosphorus, it is common to have a sand (or other type of) filter as a final stage, to remove most of the suspended solids which may contain phosphorus.

  • Disinfection, usually the final process before discharge, is the destruction of harmful (pathogenic) microorganisms, i.e. disease-causing germs. The object is not to kill every living microorganism in the water-- which would be sterilization-- but to reduce the number of harmful ones to levels appropriate for the intended use of the receiving water.

    The most commonly used disinfectant is chlorine, which can be supplied in the form of a liquefied gas which has to be dissolved in water, or in the form of an alkaline solution called sodium hypochlorite, which is the same compound as common household chlorine bleach. Chlorine is quite effective against most bacteria, but a rather high dose is needed to kill viruses, protozoa, and other forms of pathogen. Chlorine has several problems associated with its use, among them 1) that it reacts with organic matter to form toxic and carcinogenic chlorinated organics, such as chloroform, 2) chlorine is very toxic to aquatic organisms in the receiving water-- the USEPA recommends no more than 0.011 parts per million (mg/L) and 3) it is hazardous to store and handle. Hypochlorite is safer, but still produces problems 1 and 2. Problem 2 can be dealt with by adding sulfur dioxide (liquefied gas) or sodium sulfite or bisulfite (solutions) to neutralize the chlorine. The products are nearly harmless chloride and sulfate ions. This may also help somewhat with problem 1.

    A more powerful disinfectant is ozone, an unstable form of oxygen containing three atoms per molecule, rather than the two found in the ordinary oxygen gas which makes up about 21% of the atmosphere. Ozone is too unstable to store, and has to be made as it is used. It is produced by passing an electrical discharge through air, which is then bubbled through the water. While chlorine can be dosed at a high enough concentration so that some of it remains in the water for a considerable time, ozone is consumed very rapidly and leaves no residual. It may also produce some chemical byproducts, but probably not as harmful as those produced by chlorine.

    The other commonly used method of disinfection is ultraviolet light. The water is passed through banks of cylindrical, quartz-jacketed fluorescent bulbs. Anything which can absorb the light, such as fouling or scale formation on the bulbs' surfaces, or suspended matter in the water, can interfere with the effectiveness of the disinfection. Some dissolved materials, such as iron and some organic compounds, can also absorb some of the light. Ultraviolet disinfection is becoming more popular because of the increasing complications associated with the use of chlorine.


We have purified and disinfected our wastewater and discharged a clean effluent into the receiving water. Now, what are we going to with all that SLUDGE we generated along the way?

Sludge from primary settling basins, called primary or "raw" sludge, is a noxious, smelly, gray-black, viscous liquid or semi-solid. It contains very high concentrations of bacteria and other microorganisms, many of them pathogenic, as well as large amounts of biodegradable organic material. Because of the high concentrations, any dissolved oxygen will be consumed rapidly, and the odorous and toxic products of anaerobic biodegradation (putrefaction) will be produced. The greasy floatable skimmings from primary treatment are another portion of this putrescible solid waste stream.

In addition to the primary sludge, wastewater plants with secondary treatment will produce a "secondary sludge", consisting largely of microorganisms which have grown as a result of consuming the organic wastes. While not quite so objectionable, due to the biodegradation which has already taken place, it is still very high in pathogens and contains much material which will decay and produce odors if not treated further.

Ultimately, the sludge must all be disposed of. The way in which this is done depends on the quality of the sludge-- and determines how it needs to be treated. The most desirable final fate for these solids would be for beneficial use in agriculture, since the material has organic matter to act as a soil conditioner, as well as a some fertilizer value. This requires the highest quality "biosolids", free of contamination with toxic metals or industrial organic compounds, and low in pathogens. At a somewhat lower quality, it can be used for similar purposes on non-agricultural land and for land reclamation (e.g., strip mines). Poorer quality sludge can be disposed of by landfilling or incineration.

One commonly used method of sludge treatment, called digestion, is biological. Since the material is loaded with bacteria and organic matter; why not let the bacteria eat the biodegradable material? Digestion can be either aerobic or anaerobic. Aerobic digestion requires supplying oxygen to the sludge; it is similar to the activated sludge process, except no external "food" is provided. In anaerobic digestion, the sludge is fed into an air-free vessel; the digestion produces a gas which is mostly a mixture of methane and carbon dioxide. The gas has a fuel value, and can be burned to provide heat to the digester tank and even to run electric generators. Some localities have compressed the gas and used it to power vehicles. Digestion can reduce the amount of organic matter by about 30 to 70 percent, greatly decrease the number of pathogens, and produce a liquid with an inoffensive, "earthy" odor. This makes the sludge safer to dispose of on land, since the odor does not attract as many scavenging pests, such as flies, rodents, gulls, etc., which spread pathogens from the disposal site to other areas-- and there are fewer pathogens to be spread.

A liquid sludge, which might contain 3 to 6% dry weight of solids, can be dewatered to form a drier sludge cake of maybe 15 to 25 percent solids, which can be hauled as a solid rather than having to be handled as a liquid. Equipment used to dewater sludge includes centrifuges, vacuum filters, and belt presses or plate-and-frame presses. Chemical coagulants are commonly added to help form larger aggregates of solids and release the water.

Click here to see an animation of a belt filter press in action.

Further processes such as composting and heat drying can produce a drier product with lower pathogen levels. Another approach involves treatment with lime (calcium oxide), which kills pathogens due to its highly alkaline nature as well as the heat that is generated as it reacts with the water in the sludge; this also results in a drier product. A final disposal method which eliminates all of the pathogens and greatly reduces the volume of the sludge is incineration. This is not considered a beneficial use, however, and is becoming less popular due to public concerns over air emissions.

Sludges from physical-chemical treatment of industrial waste streams containing heavy metals and non-biodegradable toxic organic compounds often must be handled as hazardous wastes. Some of these will end up in hazardous waste landfills, or may be chemically treated for detoxification-- or even for recovery of some components for recycling. Recalcitrant organic compounds can be destroyed by carefully controlled high-temperature incineration, or by other innovative processes, such as high-temperature hydrogen reduction.


In the handling and treatment of both wastewater and sludge, a prime concern is

odor control
.

In the sewers, prevention of anaerobic conditions and sulfide formation is an important consideration in preventing odors. Hydrogen sulfide is also the major cause of sewer corrosion. If the water is warm and the flow is not rapid enough to aerate the water and scour the pipes, addition of chemicals such as nitrate, hydrogen peroxide or iron compounds can be helpful. In processes where odors are inevitable, the areas must be contained and ventilated. The air then has to be passed through some type of treatment system, such as an activated charcoal bed, a chemical scrubber (often using hypochlorite solution), a compost pile type biofilter-- or the air can even be used as part of the air supply for an activated sludge system.


I have tried, on this page, to introduce the basics of wastewater treatment. There are many variations and different combinations of treatment processes, as well as innovative methods not discussed here. I have focused on conventional treatment processes, which tend to be built in concrete structures and use a lot of energy-consuming machinery, with the goal of eliminating pollutants. There has been considerable interest, recently, in more &quotlow-tech", environmentally friendly, wastewater treatment processes which consume less energy and allow for recycling of more of the nutrients. My links page contains some information about some of these alternative treatment methods. Some companies involved in the production of phosphates for fertilizer use are even interested in recovering these compounds from wastewater to supplement the supply of mined phosphate rock. Water pollution control is a field in which much process research and engineering development is continuing to taking place.

Please let me know of any glaring inaccuracies or omissions you may find. (I am a chemist with a wastewater operator's license, not a sanitary or environmental engineer.)


Computers in Water Pollution Control

Computers find extensive use in the field of water pollution control. Software stream models are available to predict the effects of pollutants entering the waterways. These can be used by regulatory agencies to set limits on allowable discharges. The movement and treatment of pollutants in groundwater as a result of spills and leaks can be similarly modeled. Programs are available to help deal with the complexities of designing wastewater collection systems (sewers) and predicting the effects of storm water flows. Models are used by engineers to design the types of biological, chemical, and physical wastewater treatment processes described above, so that they will remove pollutants to the required levels. These programs can also be used by operations staff to optimize the treatment processes, and even for partial automation by accepting real-time information from sensors and using the information to control pumps, valves, aerators, etc. Software is available for scheduling equipment maintenance, tracking plant performance, preparing reports for regulatory agencies, and managing industrial pretreatment programs. High volume analytical laboratories can also use laboratory information management systems (LIMS) to keep track of samples, store analysis and quality control results, and produce reports. In many cases, instruments can be connected directly to the LIMS to reduce transcription errors.

Source : http://www.geocities.com/rainforest/5161/wwtps.htm

Saving water in the home

Imagine living in a house without running water or modern washing appliances... For some this might be utopian paradise but for most it would be a nightmare. Running water is an incredibly valuable resource with an almost endless list of applications and uses in and around the home.

Kitchen
The kitchen is a major consumer of water in the home, using around 10% of total household water consumption for cooking, cleaning, washing or drinking.
The dishwasher is the highest consumer of water in the kitchen. Installing a water efficient model will save you not only water, but also money. Before purchasing a new dishwasher, check the appliance for a WELS (National Water Efficiency Labelling and Standards scheme) label. The WELS scheme labels products for water efficiency - the more stars, the more water efficient the product. A WELS dishwasher uses half the water of an average model.

Handy Tips
  • To avoid wasting drinking water from a running tap, collect it in a bottle or jug and store it in the fridge until it is cool enough to drink.
  • Garbage-disposal units use about 6 litres of water per day. Put suitable food scraps into a composter or worm farm rather than down the kitchen sink.
  • When you clean your fish tank, use the ‘old’ nitrogen and phosphorous-rich water on your plants.
Dishwasher Tips
  • Look for dishwashers that have a National Water Conservation or WELS Label. The best water rating achieved by dishwashers is 5 star.
  • Only use the dishwasher when you have a full load.
  • Use the rinse-hold setting on the dishwasher, if it has one, rather than rinsing dishes under the tap.
Top Tap Tips
  • When washing dishes by hand, don’t rinse them under a running tap. If you have two sinks, fill the second one with rinsing water. If you have only one sink, stack washed dishes in a dish rack and rinse them with a pan of hot water.
  • Use washing up liquid sparingly as this will reduce the amount of rinsing required when washing dishes by hand.
  • Use a plugged sink or a pan of water. This saves running the tap continuously.
  • When boiling vegetables, use enough water to cover them and keep the lid on the saucepan. Your vegetables will boil quicker and it will save you water, power and preserve precious vitamins in the food.
  • Flow controlled aerators for taps are inexpensive and can reduce water flow by 50%.
  • Don’t use running water to defrost frozen food. Ideally place food in refrigerator to defrost overnight.
  • Catch running water whilst waiting for it to warm up. Use it to water plants, rinse dishes or wash fruit and vegetables.
  • If you have a leaking tap, replace the washer or other components as required. Dripping taps can waste 30 – 200 litres of water per day.
  • Insulate hot water pipes. This avoids wasting water while waiting for hot water to flow through and saves energy.
  • Make sure your hot water system thermostat is not set too high. Adding cold water to cool very hot water is wasteful.
Laundry
15-20% of all water consumed in the home is used in the laundry, making this room a high consumer of not only water but also energy and detergents.

There are many inexpensive ways to save water in the laundry. One of the easiest is to install a water efficient washing machine. Many major appliances and tapware products carry labels according to their water efficiency. Look out for the WELS (Water Efficience Labelling and Standards) label - this is displayed on the product or a swing tag. It demonstrates that manufacturers and importers have ensured their product has been tested and complies with the Australian Standard in the respective category.

Washing Machine Tips
  • Look for washing machines that have a four or more star rating (WELS label).
  • Consider buying a water efficient front loading washing machine.
  • Check the water efficiency performance of any product before buying.
  • Adjust the water level to suit the size of the wash load - some new water efficient models will do this automatically.
  • Wash with a full load and you'll save 10 litres of water each wash.
  • Use the sud-saver option, if your old machine has one, when you have several loads to wash.
Top Tap Tips
  • Leaking taps can usually be fixed with a new washer. This is easy to do - remember to turn the water off at the mains before you start.
  • If the tap still drips, call a plumber - the cost incurred will save you money on your water bills in the long run.
  • Insulate hot water pipes - this avoids wasting water while waiting for hot water to flow through and saves energy.
  • Make sure your hot water system thermostat is not set too high - adding cold water to cool very hot water is wasteful.
Bathroom
DID YOU KNOW?
Nearly half of all water consumed in the home is used in the bathroom. 20% of that water is flushed down the toilet…
It’s easy to become water-smart in the bathroom if you follow a few simple steps.

Before buying a new bathroom appliance, check the manufacturer’s water efficiency labels. WELS is Australia’s new Water Efficiency Labelling and Standards (WELS) Scheme which allows consumers to compare the water efficiency of different products using a star rating scheme.

By buying more water-efficient products, you can save money on water and electricity bills and help the environment.

Look for a product that has a high star rating – the more stars, the more water efficient the product. A standard 3-star rated showerhead can save the average home $150 a year in water bills and can be purchased for as little as $50.

Saving water in the shower...
DID YOU KNOW?
Three star rated showerheads use no more than 9 litres of water per minute, while old style showerheads use 15 – 20 litres per minute. If you shower for six minutes, a water efficient showerhead can save up to 50 litres of water for each shower or up to 20,000 litres of water per person per year

  • Take shorter showers. Limit time spent in the shower to soap up, wash down, and rinse off. Shorter showers save on energy costs associated with heating water
  • Use a shower timer. Choose from a manual 4-minute egg timer or a more sophisticated electronic timer that either attaches to the shower wall or showerhead, or is wired into the wall during construction
  • Use a bucket to collect water while waiting for the shower to get hot
  • Shave your legs before taking a shower. Use running shower water to rinse off.
  • Insulate hot water pipes. This avoids wasting water while waiting for hot water to flow through and saves energy.
  • Consider an instantaneous water heater if your existing water heater is located some distance to the bathroom. Talk to a plumber first to make sure it will work adequately with your three star showerhead.
  • Make sure your hot water system thermostat is not set too high. Adding cold water to reduce the temperature of very hot water is wasteful

Saving water in the bath...
  • Only fill the tub with as much water as needed. Use less for kids and pets.
  • Check the temperature as you fill. Adding extra water to get the correct temperature after the bath is at the right level is wasteful.
  • Regularly check your plug for leaks and replace as necessary.
  • Bucket used bath water onto the garden, or use it to wash your car. Check that soaps and detergents in the water won’t harm garden plants.

Saving water using the toilet...
DID YOU KNOW?
The new 4-star rated toilets by Caroma can save the average home up to 35,000 litres per year. These new toilets use just 4.5 litres for a full flush and 3 litres for a half flush.


  • If you can’t afford a new toilet, you can purchase small gadgets to reduce the volume used with each flush of an older style toilet. They work by causing the toilet to flush for as long as the button is pressed. Waterwizz and Flexiflush are two types of these gadgets.
  • Leaking toilet cisterns waste litres of water each day. Check for leaks by putting a few drops of food dye in the cistern. If you have a leak, coloured water will appear in the bowl before the toilet has been flushed.

Saving water using the basin...
DID YOU KNOW?
A running tap uses about 16 litres of water per minute.

  • Turn the tap off when brushing your teeth. Wet your brush and use a glass for rinsing.
  • Don’t rinse your razor under a running tap. Filling the basin with a little warm water is as effective and less wasteful.
Fixing leaks
DID YOU KNOW? A slowly dripping tap can waste 20,000 litres in a year. Check for drips and take action now!
Alot of water is lost around the home due to leaking pipes and dripping taps. It might not seem much, but it adds up...

A slowly dripping tap can waste a couple of litres each hour, reaching almost 20,000 litres a year. That's the entire amount available each year to many people around the world!

To detect a leak, ensure all taps are turned off. Check your water meter and note the reading. Then check the reading again after about three hours. If no water has been used, the reading should be the same. If the meter has moved, you have a leak that needs to be found and fixed.

Changing the washers usually fixes dripping taps. If this does not solve the problem, contact a plumber.

Pools and Spas
Current water restrictions may limit how you fill or top up a new or existing swimming pool and spa, but you can still enjoy these great leisure activities if you follow a few simple water conservation guidelines.

Preventing water evaporation
Evaporation is a major cause of water loss from your swimming pool. It is important to remember that the evaporation rate is highest in the early evening as the air cools and the water remains warm. This can be reduced by covering the pool's surface. Covering the pool lowers the pools temperature, decreasing evaporation whilst preventing debris from falling on the pool surface. By preventing sunlight from penetrating the water, you will also reduce the amount of chemicals needed to keep the pool clean.

Pool covers
These are generally more expensive than blankets as they require a roller for storage, and take some effort to roll out and put away. They have an added safety benefit as it is difficult to fall into the pool when the cover is in place. They also cover the whole pool, preventing up to 95% of evaporation, compared with a blank where there may be gaps between a blanket and the edge of a pool.

Pool blankets
They offer a more affordable option and are available in bubble plastic or foam, which float on the water's surface. If used with a roller they can be easily be removed before pool use, then spread again after you have finished swimming for the day.

Increase shade
Covering your pool with a shade will further reduce evaporation as well as protecting swimmers from harsh sunrays. Use shade cloth or a shade sail.
Liquid pool covers
Are a new alternative available if you don't want to hide your pool water with a cover or blanket. The chemical forms a barrier on the water's surface which inhibits evaporation by up to 40%. It can either be added to the pool daily by hand or by using an automatic metering system.

Prevent wind exposure
Wind contributes to evaporation. To reduce water loss, adjust the landscape around your pool with walls and hedges that create shelter from the wind.

Tank to pool systems
Installing a rainwater tank is a great way to reduce the use of mains water in your swimming pool. Many regions now have rebates available for rainwater tanks.

Rainwater diverters are an inexpensive alternative to installing a tank. They attach to a downpipe and can be used to divert rainwater into your swimming pool. In large downpours, you will need to monitor the water level in your pool so that it does not overflow. You should consult a plumber about stormwater diversion.

What type of filter should I use?
Sand filters require backwashing which can use up to 8000L of water every year. Purchase a cartridge filter if you are installing a new pool or replacing the filter. Cartridge filters do not require backwashing to be cleaned so they use less water.

Backwashing a sand filter should be carried out once every 4 to 6 weeks. Only backwash until the glass goes clear - backwashing for longer will waste excessive amounts of water.

How can I prevent loss of water from splashing?
Avoid overfilling your pool as this will prevent your filter from working effectively and will cause water to overflow. The water level should be about half way up the skimmer box opening for the filter to function properly. If you want to allow the water level of you pool to drop below this, you will need to buy a T-piece suction line which connects to the skimmer box allowing the filter to function normally.

Change pool behaviour
Concentrate on keeping water in the pool. Try the following:
  • Discourage pool users from "bombing" and continually getting out and jumping back into the pool.
  • Drip dry on the top step so that water goes back into the pool.
  • If you need to top up, get those who use the pool to top up the water level with a bucket so they're conscious of the amount of water they've used.

Regularly check for leaks
Leaks can easily develop in the pool's membrane and piping. Even a small leak can waste 7000 litres per year. These can be difficult to detect so it is recommended that you test your water pipe's pressure when installing your pool and then once every 3 years.

Pool maintenance
  • Backwash only when necessary.
  • Check regularly for cracks and leaks.
  • Keep the pool and filters clean to reduce frequency of filter backwashing.
  • If acid has been used to clean the pool, the water should be neutralised.

What if my pool has already gone green?
If your pool has already gone green, you can kill the algae with a dose of chlorine. The green particles can then be removed by installing a pool filter bag on the return line. These bags can filter particles down to one micron and will allow you to reuse water from backwashing in your pool.

How can pool chemicals save water?
By maintaining the correct balance of chemicals in your pool year round, you will prevent your pool water from going green over winter. This means you won't need to empty and refill the pool in spring. Monitoring the chemicals in your pool will also prevent you from having to discard polluted water.

Water restrictions will affect how you fill a new pool or top up an existing one. You may have to use a bucket or order water in via a carting service depending on local water restrictions. Check with your local water provider.

Garage and driveway
Washing your car and cleaning your driveway are activities that traditionally used a lot of water. Here are some ways to reduce water consumption while still having a clean driveway and car.

Driveways
Water restrictions in most areas have meant that many businesses and home owners are no longer permitted to hose down driveways, paths, concrete and paved areas. But there are alternative ways to keep these areas clean using minimal amounts of water or even no water at all.

Use a broom, brush or rake to sweep and clean outdoor paths and paving instead of hosing them down with water.

Tips for washing cars
  • Use a waterless car wash - there are now a number of these products available
  • If water restrictions permit, wash cars, boats and other vehicles on the lawn (if practical) with a bucket not a running hose. Use a trigger nozzle or a positive shut-off nozzle infrequently for occasional rinsing sprays.
  • Use captured ‘warm-up’ water from inside the home or treated greywater to wash vehicles.
  • Use a commercial car wash that recycles its wash water.
Case study
  • Commercial car wash businesses survive water restrictions
Greywater use

Greywater (or grey water) is typically water from baths, showers, hand basins and washing machines. It does not include water from the toilet. Water from kitchen sinks and dishwashers is also technically greywater, however the high concentration of food wastes and chemicals mean that it is less suitable for re-use. Should you reuse greywater?
Using greywater may be the only solution for keeping gardens alive during periods of hot, dry weather. Greywater replaces the need to use mains water for watering gardens or lawns and can potentially save thousands of litres of drinking water a year.

Benefits of using greywater:

  • Decreases your water bills.
  • Reduces the amount of sewage discharged to the oceans or rivers.
  • Irrigates your garden during drought periods.
  • Can be used to keep gardens alive when water restrictions prevent the use of mains water.

  • Greywater Do's and Dont's
    The following list covers some of the major do's and don'ts when using a greywater system and is applicable to all residents in Australia. For further information, contact your local council or water retailer.

    Do
    • Use low phosphorus detergents
    • Diverted greywater (untreated) should only be used on the garden and not always in the same spot
    • Apply diverted greywater to the garden by a below ground seepage pipe. This will reduce human exposure to the water.
    • Use greywater only during prolonged warm, dry periods: use only what you need to meet the plant's water requirements
    • Ensure greywater is diverted to the sewer during wet periods
    • Install a diversion system that is 'fail-safe', where the greywater will automatically be diverted to the sewer if the greywater system blocks or malfunctions
    • Stop using greywater if you smell odours and your plants do not appear to be healthy
    • Wash your hands after watering with greywater and after gardening in greywater irrigated areas
    • Use less fertiliser when irrigating with greywater
    • Ensure greywater does not contaminate any source of drinking water: extreme care must be taken to ensure there is no cross-connection between the greywater re-use system and the drinking water supply
    Don't
    • Never water vegetable gardens if the crop is to be eaten raw
    • Never use greywater that has faecal contamination, for example, wastewater used to wash nappies
    • Never store untreated greywater for more than 24 hours
    • Never drink greywater or allow children or pets to drink or play with greywater
    • Never allow greywater to flow beyond your property boundary or enter stormwater systems
    • Do not use kitchen wastewater (including dishwashers) - it contains highly concentrated food wastes and chemicals that are not readily broken down by soil organisms
    • Do not allow greywater to pool or stagnate as this will attract insects and rodents, which may transmit disease.
    Greywater systems, permits, costs and rebates
    Greywater systems vary greatly in price, depending on the complexity of the system and the intended end-use for the water. A simple diverter can cost under $100, while complete treatment systems can cost several thousand dollars. For further information on systems and prices visit our product library.
    The permits required to install a greywater system and costs and rebates that apply vary according to where you live. For further information, contact your local council or water retailer.

    Rainwater collection

    Rainwater tanks, traditionally an icon of the Australian outback, are becoming a more common feature in urban communities, with around 17% of all households installing a tank on their property. More households need to purchase a rainwater tank if the community is to make a real difference to conserve rapidly depleting water supplies.

    Why use rainwater?
    • Using rainwater can reduce your water bills as rainwater is free. Tank rebate schemes are available in many states. For further information, contact your local water retailer.
    • Collecting rainwater allows you to be prepared for times of low rainfall, so you can still maintain your garden, especially if there are water restrictions in your area.
    • It reduces the load on stormwater systems because roof runoff is not flushed into the drains.
    • Using rainwater reduces the need to build more water storage dams, which may have to be situated in environmentally sensitive areas.

    Benefits of installing a rainwater tank
    • Saves large amounts of water which can be used in the garden or in the home.
    • Requires a relatively simple system which is easy to use.
    • During the wet season, when the garden doesn't need any extra watering, rainwater can be connected to the house and used for toilet flushing as well as in the laundry
    • Rainwater is also suitable for use in pools and for washing cars
    • In some rural areas, it is possible to use rainwater for all domestic uses, and not draw upon the mains supply.

    Issues associated with rainwater use
    There are some important factors that affect the quality of rainwater, which may also become health issues:
    • Contamination from pollutants found in roof and pipe materials.
    • Contamination from bird droppings, local pollution, and organic material collected on the roof.
    • Breeding of mosquitos in the water supply.
    The quality of water you need to maintain will depend on its use. However, water from rooftops that contain harmful chemicals should not be used for any purpose. Obviously, drinking water will have to meet the standards set by health authorities.

    These quality issues can be overcome if you use approved products and techniques. Tanks and other equipment must meet the required standards, and state health authorities will approve most reputable manufacturers and installers. Your local water authority should be able to recommend high quality products and approve your system.

    As government, industry and community attitudes towards environmental issues continue to grow, water conservation is a critical factor in reducing our overall water consumption.

    Did you know?...

    • On average, a person uses about 200 litres of water per day, of which 5-10 litres is for basic survival, ie drinking and food preparation.
    • The other 190 litres is discretionary and is used for washing (showers, dishes, clothes, toilets) and the garden.
    • Some communities have been successful in reducing average personal tap water usage to as low as 130 litres per day.
    • Approximately half the water supplied to urban areas in Australia ends up as waste water, according to a report by the Institute for Sustainable Futures prepared for the Water Services Association in 1998.
    Together we can all do our bit to help reduce water consumption. Installing water saving products can make a difference and despite the initial cost, they are an investment: in the long term, you will be saving money and helping the environment. There's plenty of water saving ideas and initiatives to inspire you on the savewater website.

    Source : http://www.savewater.com.au/index.php?sectionid=12